

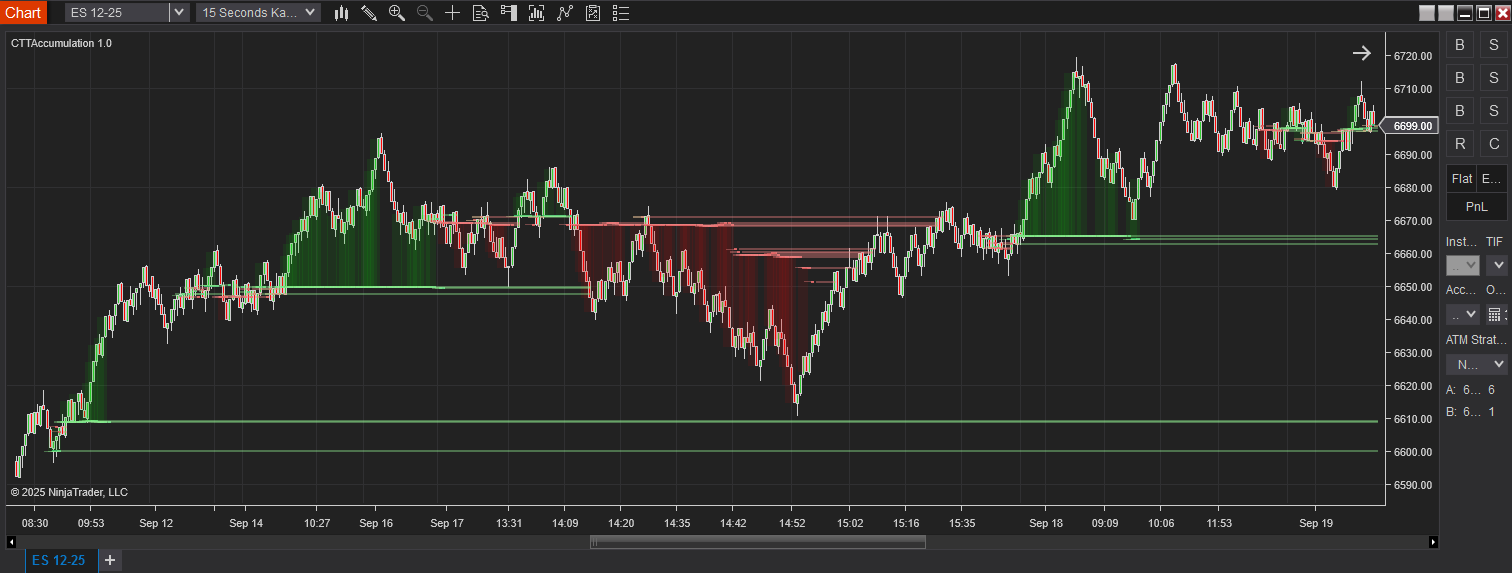
The CTTAccumulation indicator finds the price levels where market activity has repeatedly built up ("accumulated").
These levels often act as support (default Green) or resistance (default Red).
The tool highlights the most relevant areas and optionally draws extended level lines that you can use for trade planning, entries, and risk placement.
How to read the chart and act
1.
Identify the prominent accumulation zones and
extended lines to the right—these are likely support/resistance.
2.
Check if the background suggests Trend Fill (if
enabled). Trade with the dominant direction when possible.
3.
In chop, prioritize mean‑reversion tactics.
Outside chop, look for break‑retest or pullback‑to‑level setups.
4.
Always define risk: stops beyond the opposite
side of the zone or below/above the extended line.
5.
Scale‑out on first touch reactions; let a runner
target the next major level.
Practical recipes
A. Fast scalp on ES (1–2 min or 1500–3000 tick)
·
Lookback Mode: Bars = 100 (or Minutes = 60)
·
Bin Size (ticks): 1–2
·
Top Node Count: 6–8
·
Min Node %: 1.0–1.5%
·
Zone Half‑Width: 2–3
·
Draw Extended Level Lines: On; Line Width: 2
·
Detect Chop: On; Tightness: 10–14; Lookback: 30
Note: Plan
entries at/around extended levels with small tolerance. Consider fading the
first touch, then switch to breakout mode if a level decisively breaks and
holds.
B. Intraday swing (5–15 min)
·
Lookback Mode: Minutes = 120–240
·
Bin Size (ticks): 2 (ES) / 4 (NQ)
·
Top Node Count: 8–10; Min Node %: 0.8–1.2%
·
Zone Half‑Width: 3–4; Opacity: 35–45%
·
Use Swing Gate: On; Swing Strength: 3–4
·
Detect Chop: On; Lookback: 40–60; Tightness:
12–20
Note: Use zones
to locate pullbacks in trend and define stop placement just beyond the zone.
C. Range‑day tactics
·
Detect Chop: On; Increase Tightness and Lookback
until ranges are clearly flagged.
·
Fade touches of extended levels; avoid entries
mid‑range.
· Reduce Top Node Count if the chart feels cluttered.
Troubleshooting
I see too many levels.
Reduce Top Node Count and/or
increase Min Node % of Total. Increase Bin Size slightly to merge tiny
clusters.
Levels look too jumpy day‑to‑day.
Use a longer lookback (more Bars
or Minutes) and consider increasing Bin Size one notch.
Zones cover too much of the chart.
Lower Zone Opacity % or reduce
Zone Half‑Width. You can also toggle Show Zones off and rely on extended lines
only.
I want fewer false breakouts.
Enable Detect Chop and increase
Chop Tightness and/or Lookback. Use Swing Gate to wait for confirmed swings.
Tags: CTTAccumulation